Wellington Water
2025
Wellington Water is moving from short-term, urgent messaging to an always-on educational approach that encourages smarter everyday water use.
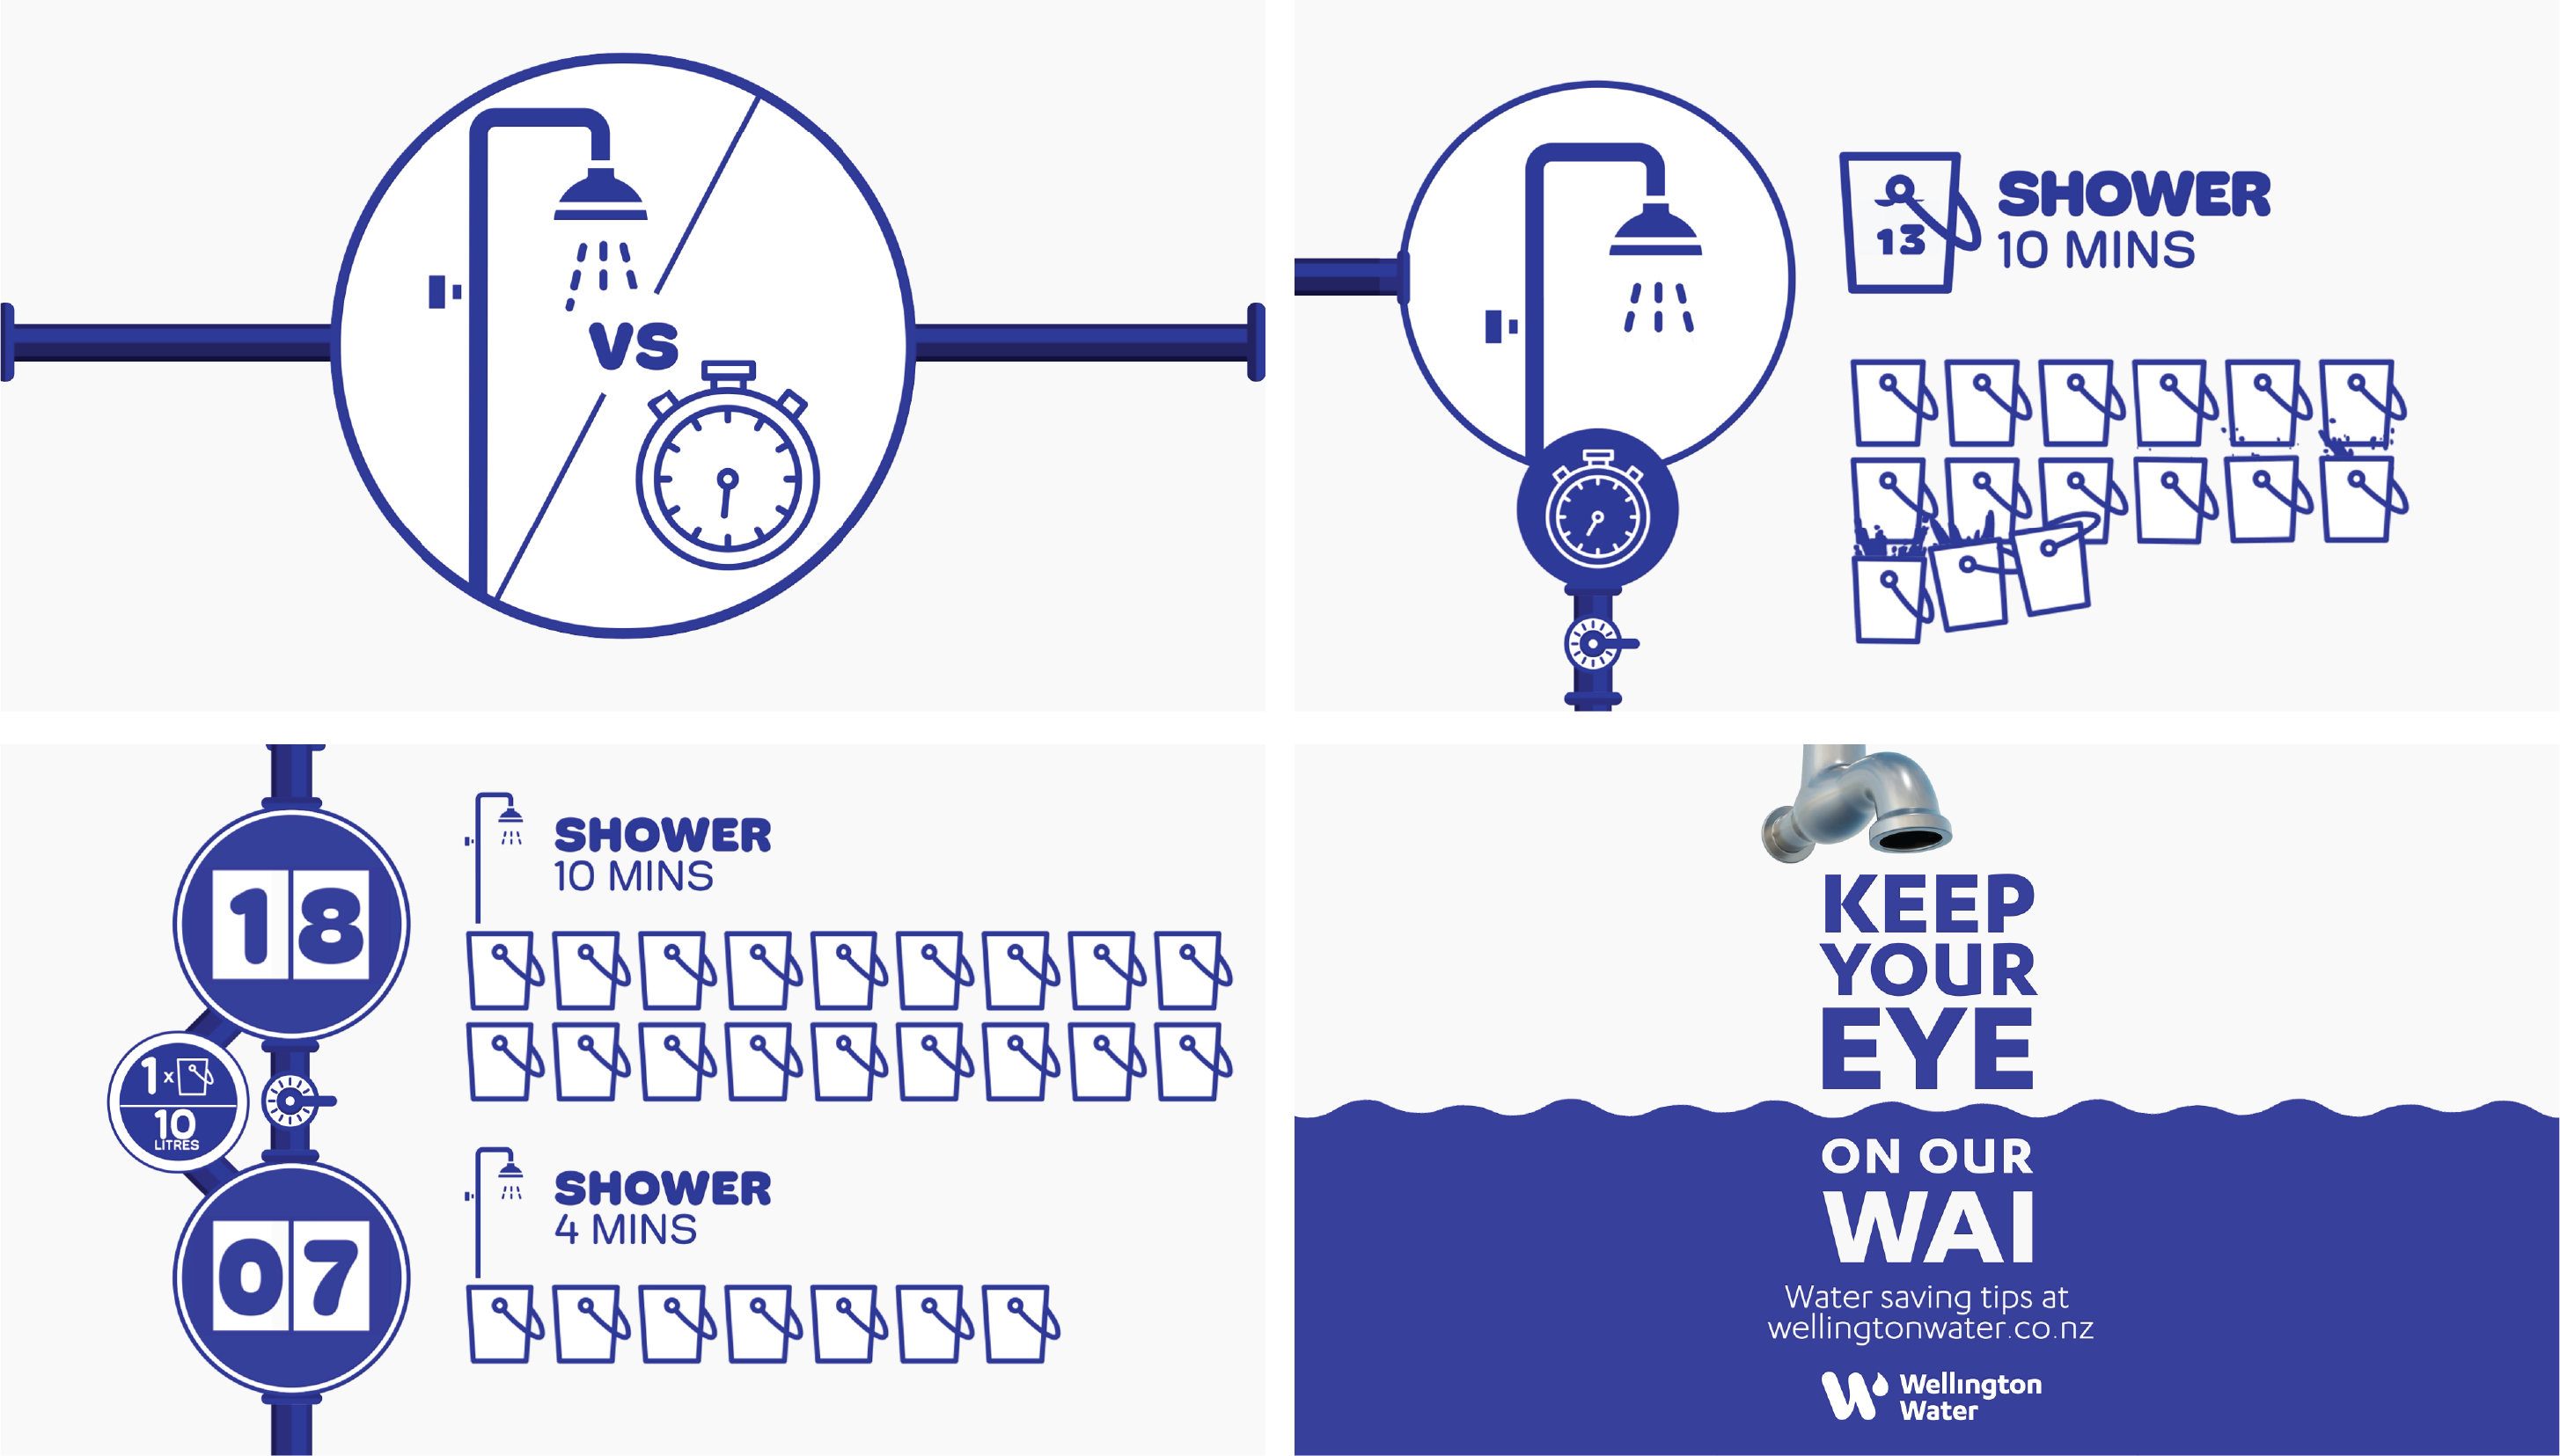
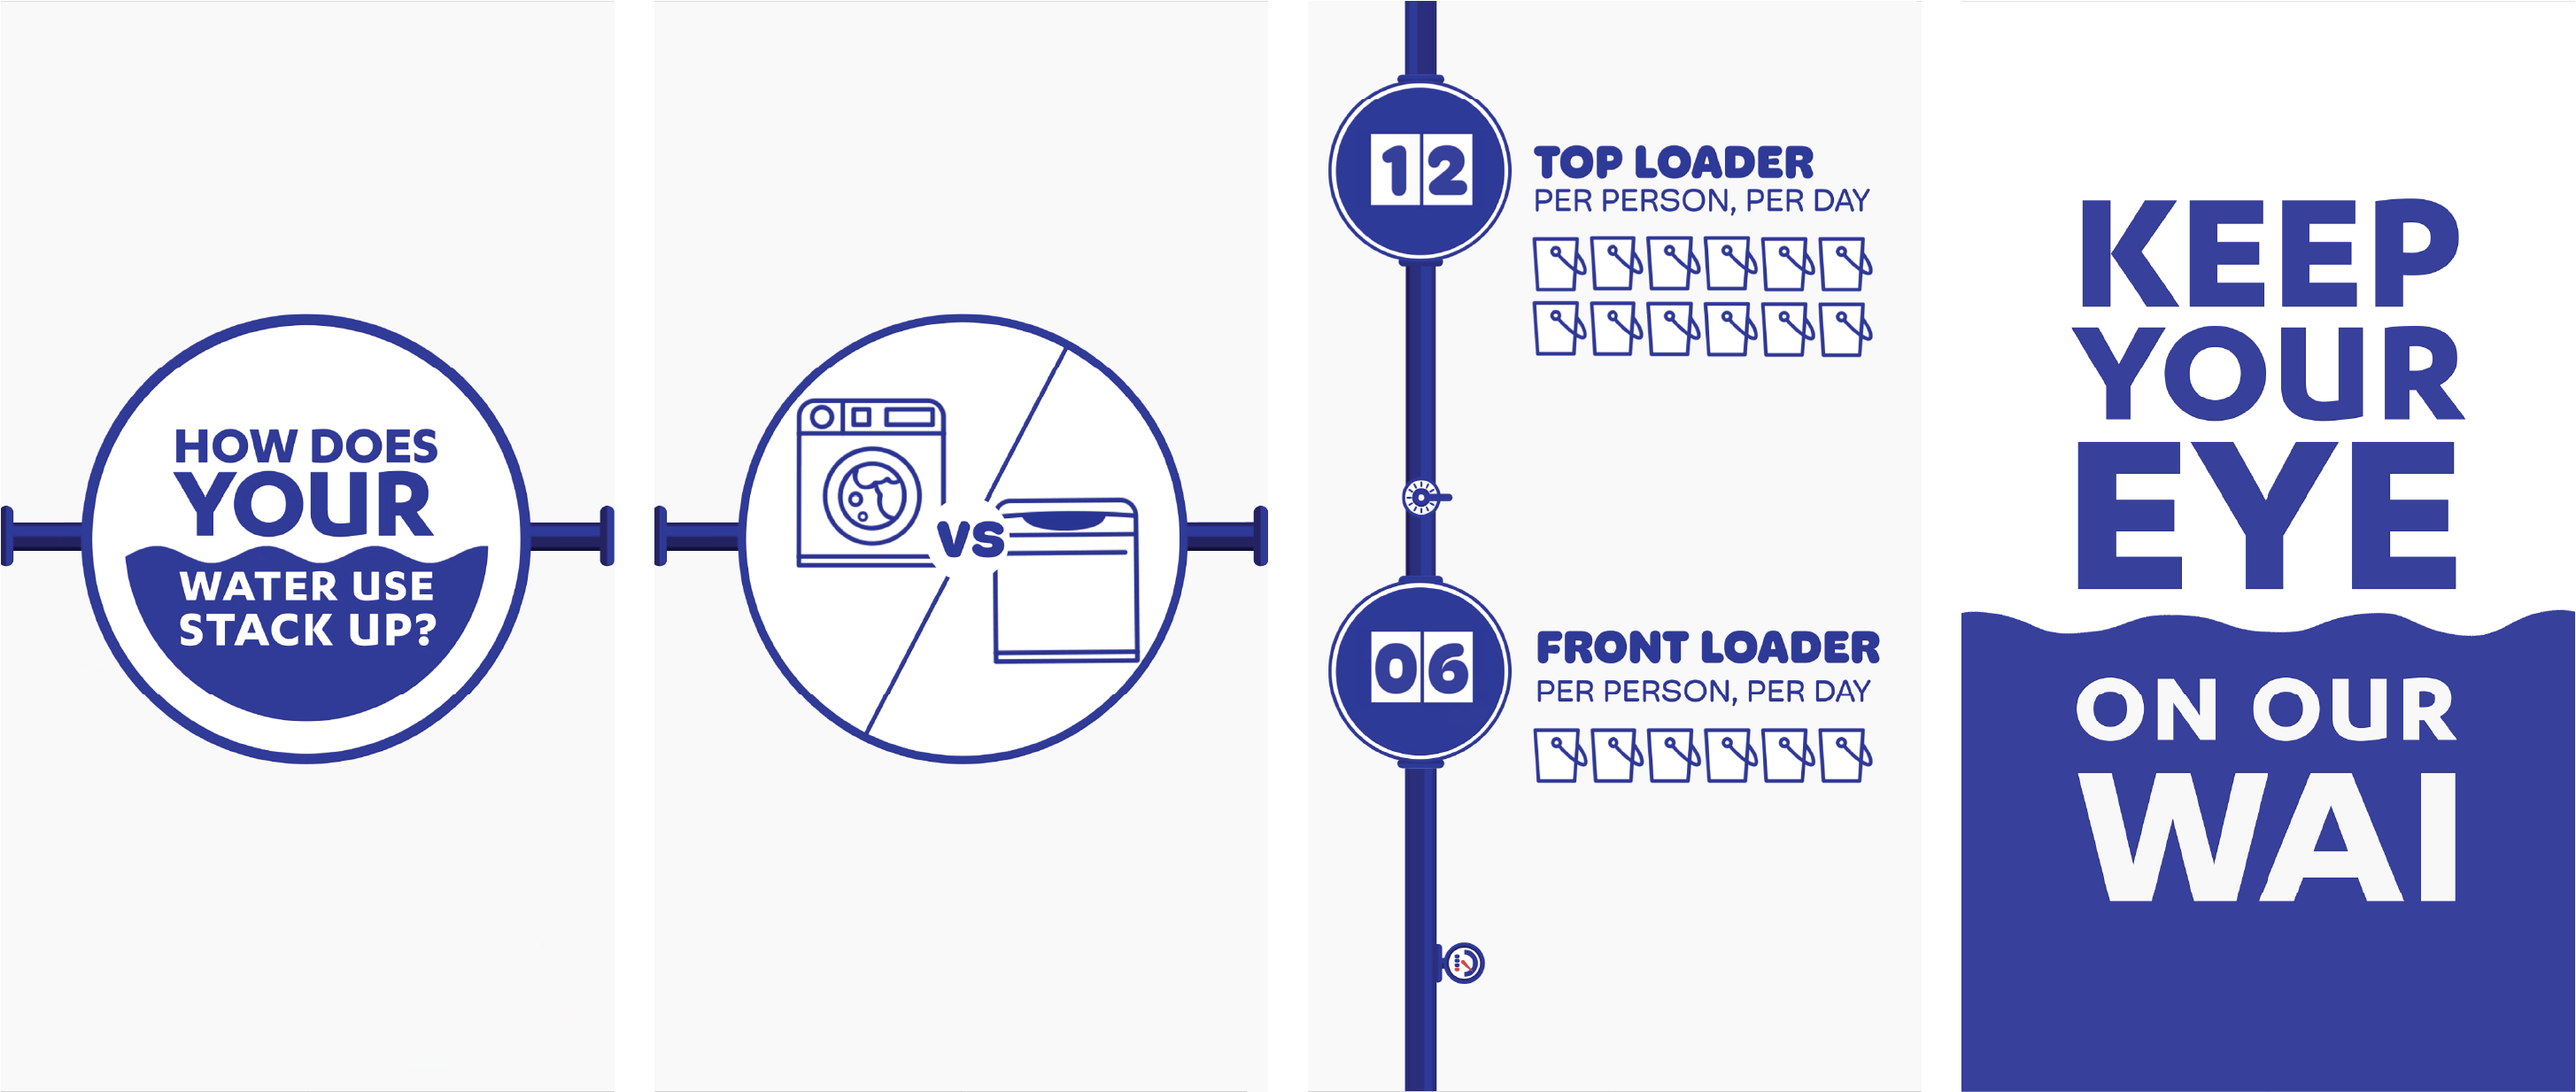
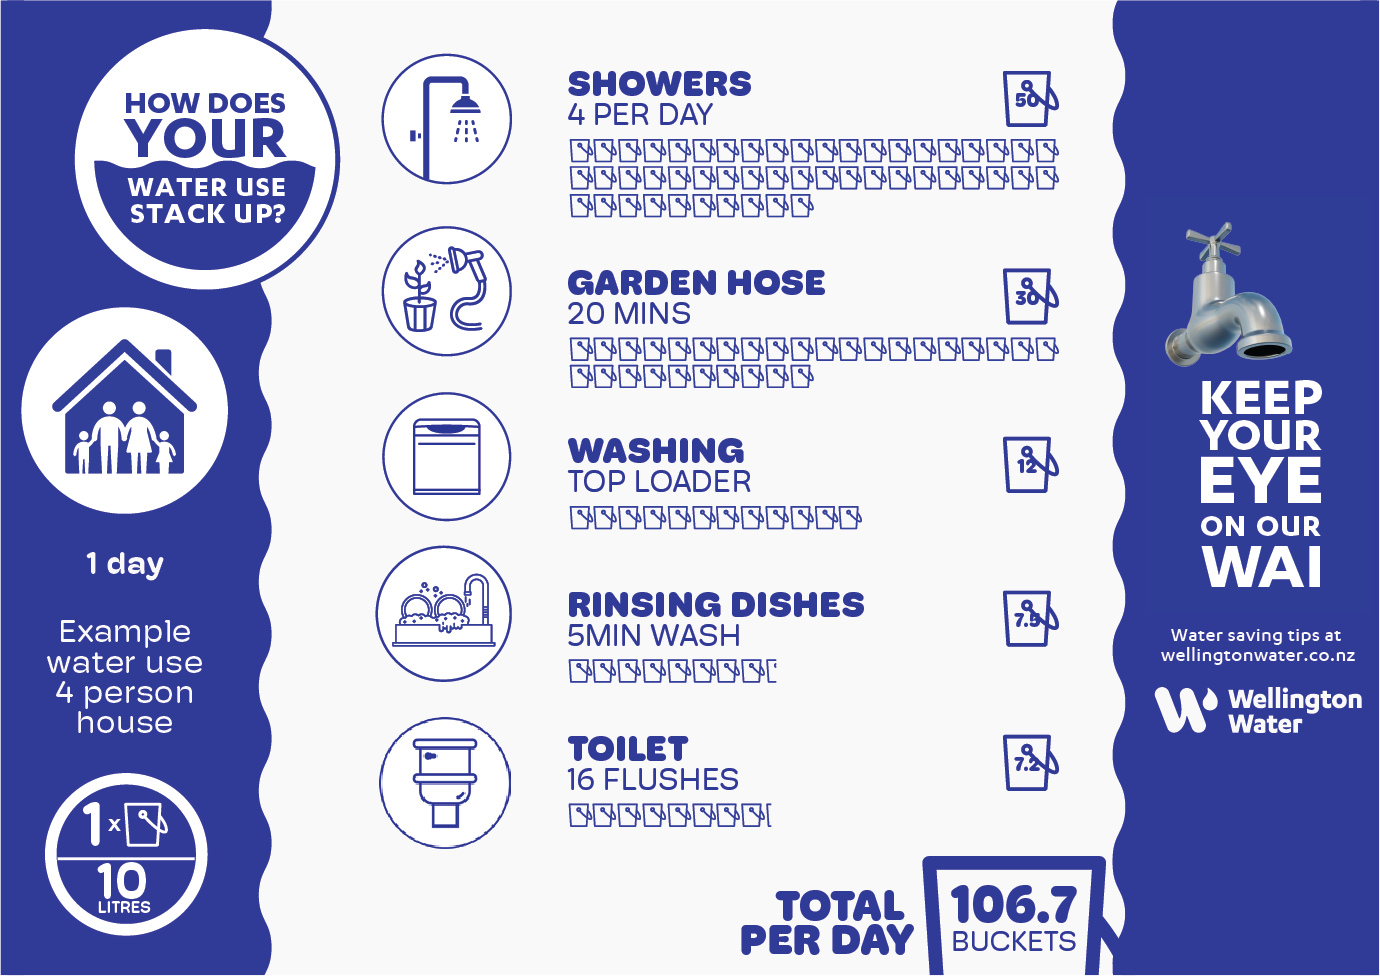
An infographic is required to visualise comparative water use data in a way that’s easy to grasp, helping Wellingtonians understand how everyday actions add up and where they can make the biggest impact.
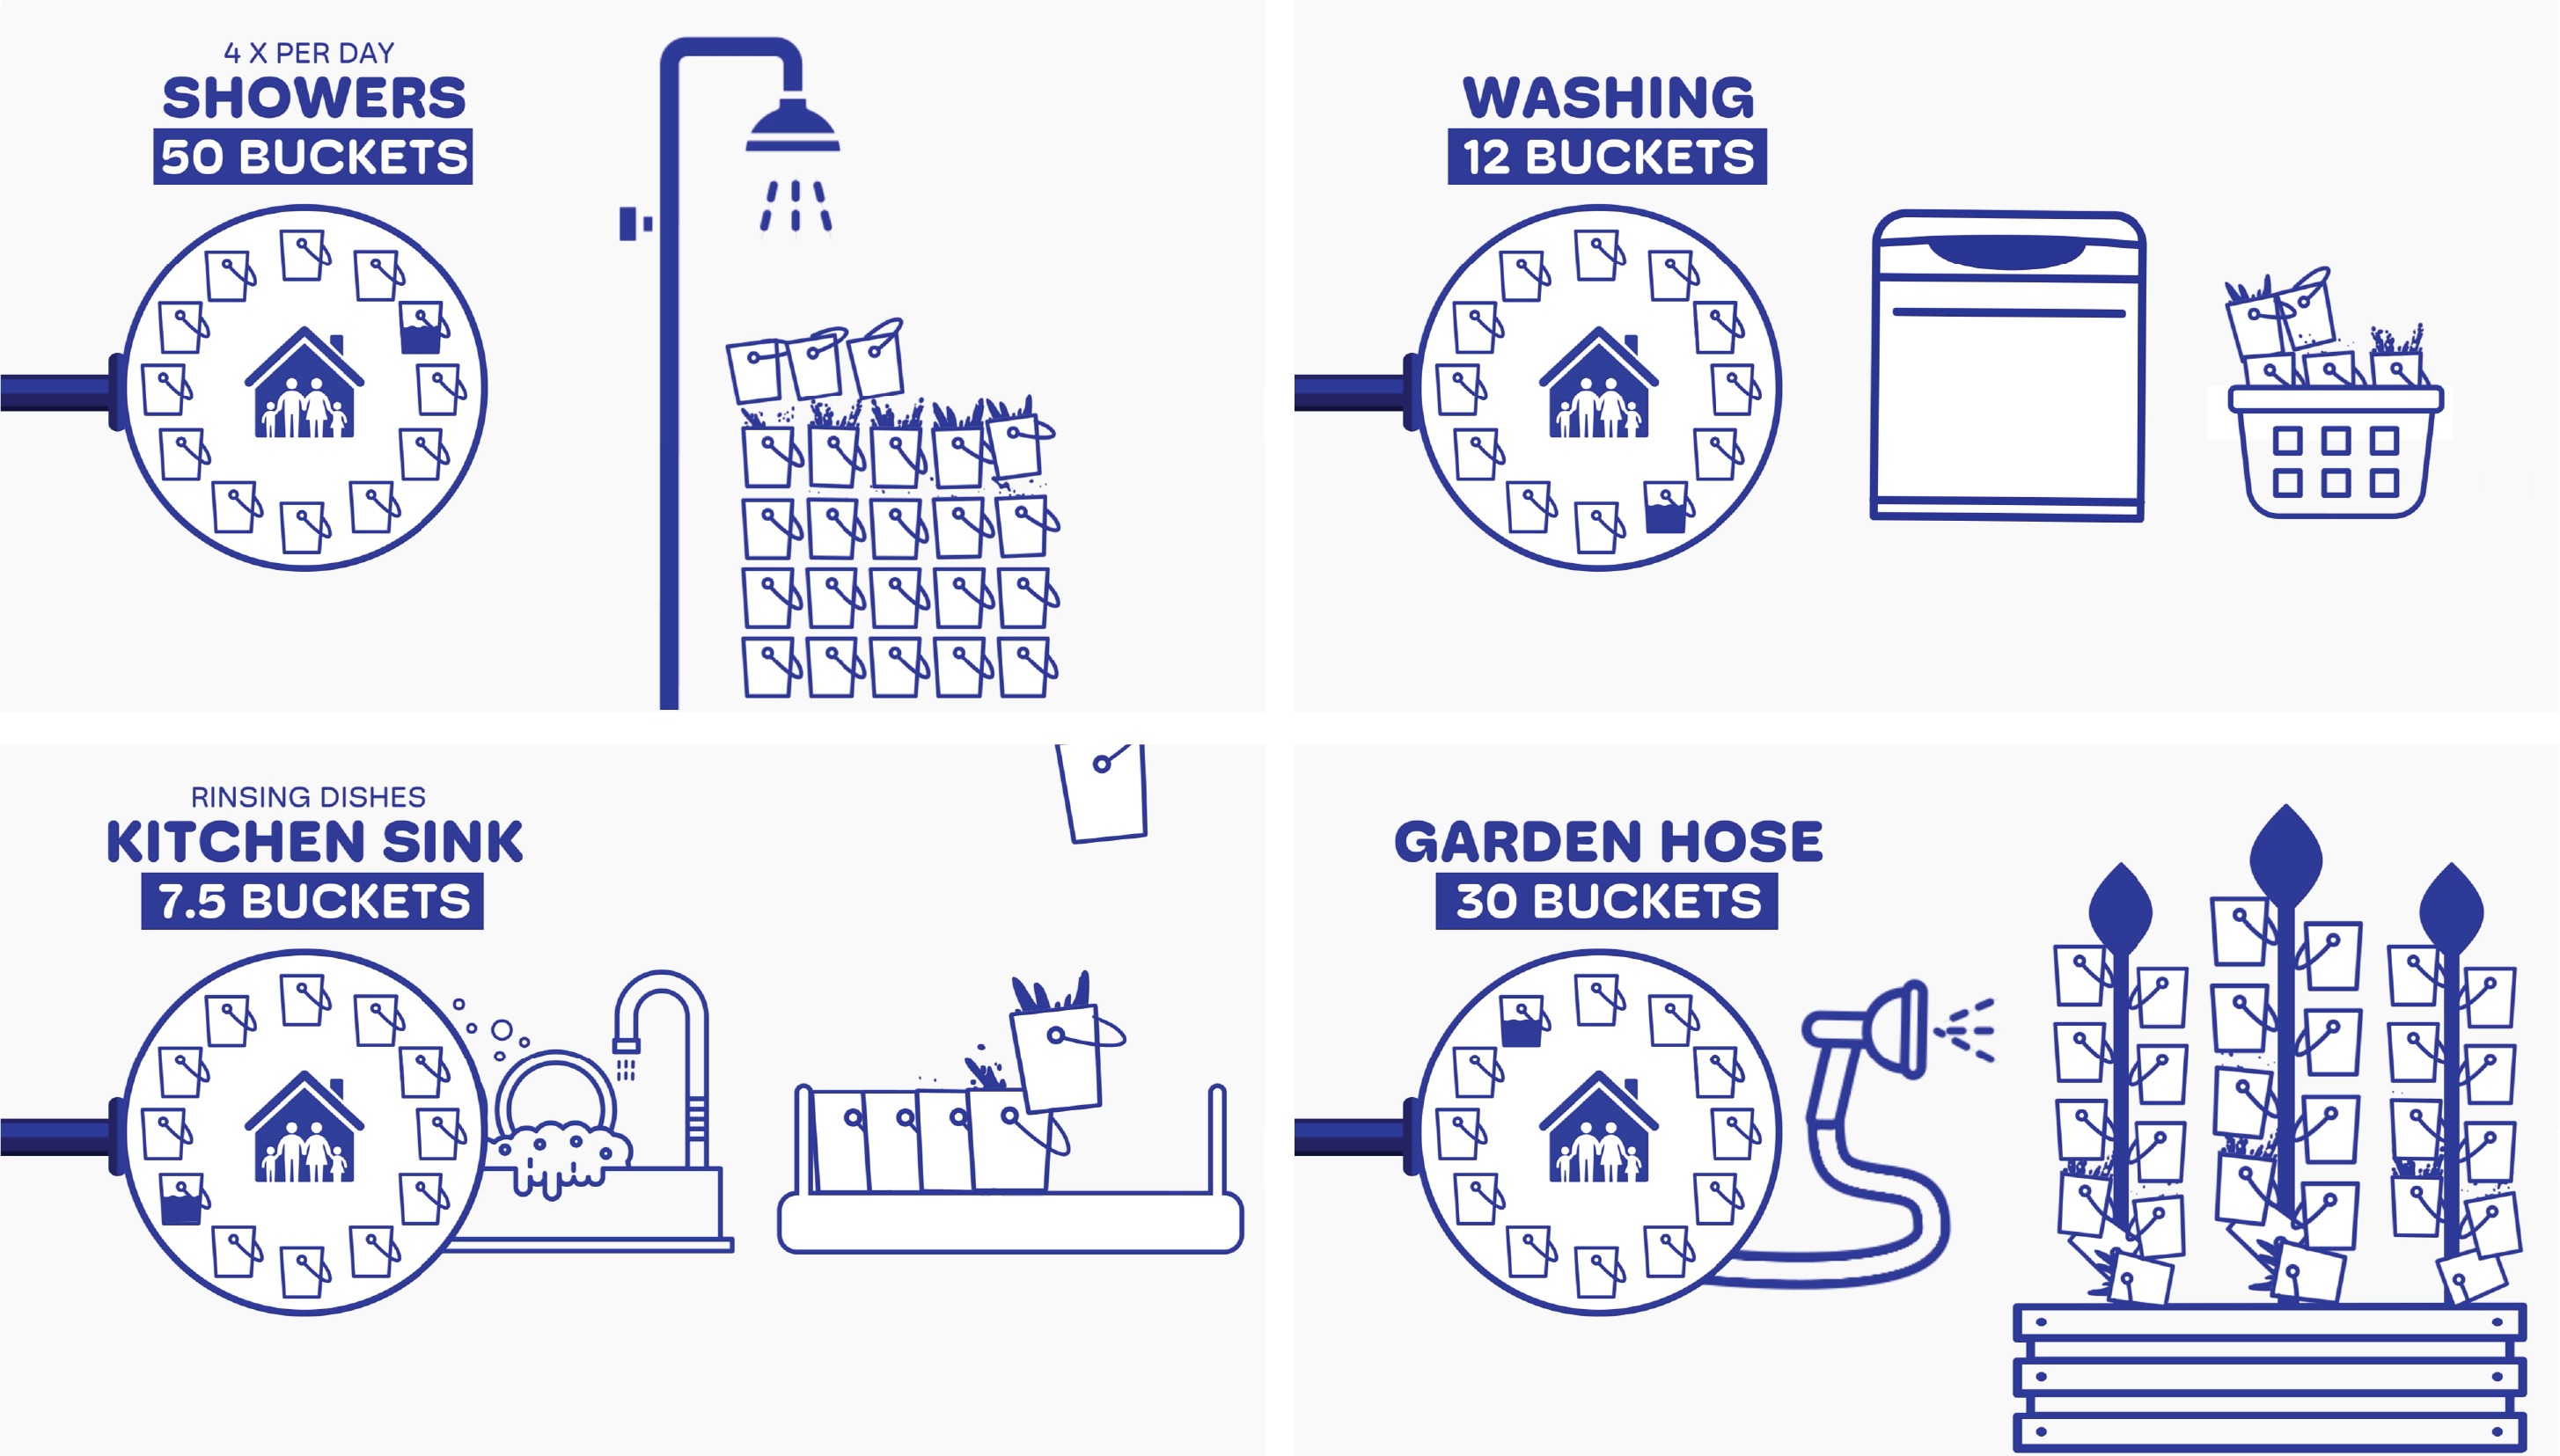
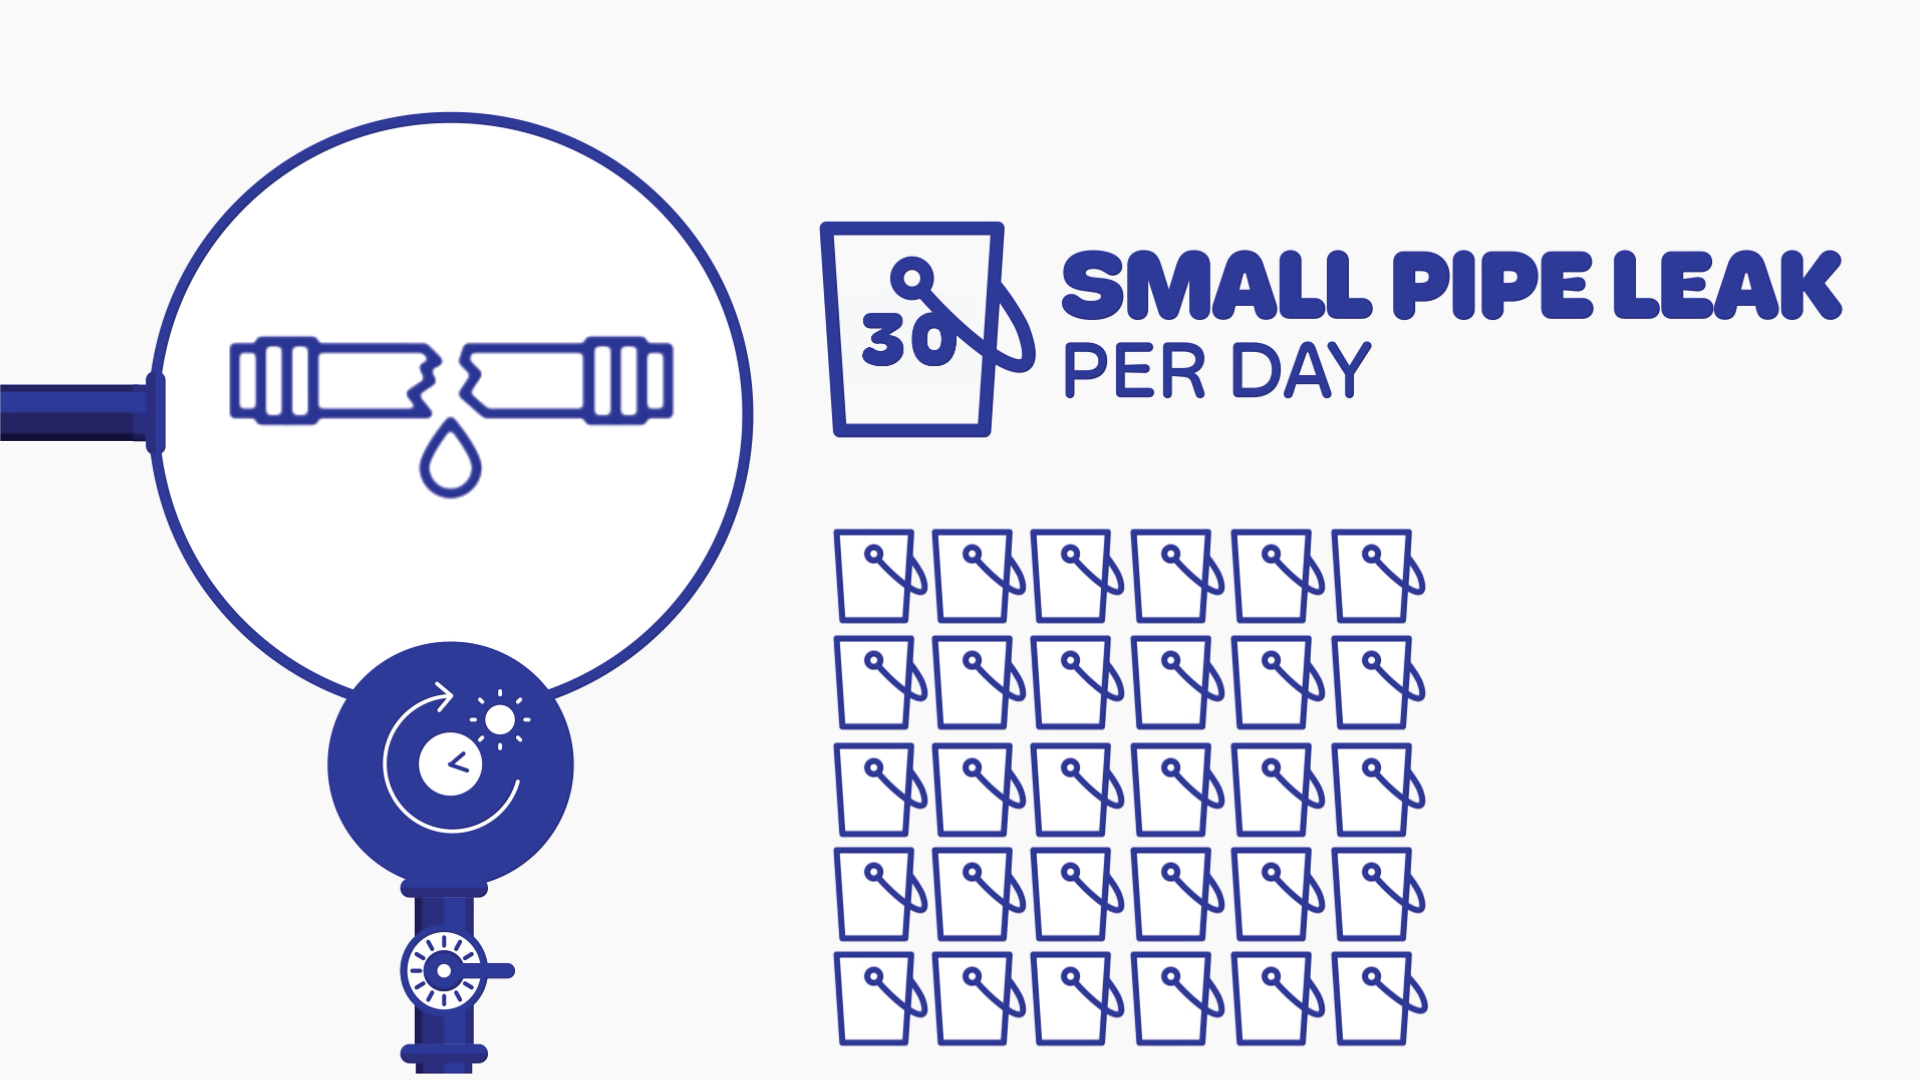
An informative infographic look will keep the animations factual, approachable and objective.
Using buckets as way to visualise water use (1 bucket = 10L) each of the areas will reflect positive and negative water use behaviour.